This is a mathematical calculation only, not investment advice.
Percent Change Volatility Calculator – Measure Fluctuation Over Time
This volatility calculator measures how much a series of values fluctuates over time. Instead of looking only at the first and last value, it calculates the **percentage change between each consecutive value**, then computes the **standard deviation** of those changes — a common way to express volatility in finance, statistics, and data analysis. This gives you a clearer picture of how “bumpy” or “smooth” the data is: - high volatility → large swings - low volatility → small, steady changes It works for daily prices, weekly values, monthly data, or any ordered time series.Volatility Formula (Standard Deviation of Percent Changes)
The calculator performs two steps: 1. Compute the percentage change from each value to the next 2. Compute the standard deviation of those percentage changes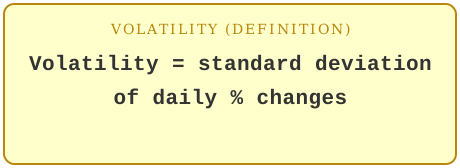
This method is widely used in finance to measure how much a stock, index, or asset fluctuates day‑to‑day.
Examples of Percent Change Volatility
Example 1: Daily pricesValues: 100, 102, 99, 105, 103, 108
Daily changes: +2%, −2.94%, +6.06%, −1.90%, +4.85%
Average daily change: 1.61%
Volatility (standard deviation): about 3.44%
A higher standard deviation means bigger day‑to‑day swings.
Example 2: Weekly closing prices
Values: 50, 55, 48, 60
Changes: +10%, −12.73%, +25%
Average change: 7.42%
Volatility: about 15.6% — a wide spread, showing large week‑to‑week swings.
Example 3: Steady weekly prices
Values: 50, 51, 49, 50
Changes: +2%, −3.92%, +2.04%
Average change: 0.04%
Volatility: about 2.7% — much steadier than the previous example.
When to Use This Calculator
Use this calculator when you have a **series of values over time** and want to measure how much they fluctuate, not just the overall change from start to finish. It is ideal for: - stock prices - commodity prices - weekly or monthly financial data - scientific measurements - any time‑ordered dataset For a simple before/after comparison instead, use the stock price percentage change calculator.Frequently Asked Questions
How many values do I need?At least 3, so there are at least 2 period‑to‑period changes to compare.
Does higher volatility mean a worse investment?
Not necessarily. Volatility describes **fluctuation**, not direction or quality. High volatility means bigger swings — both upward and downward.
Can I use monthly or yearly data instead of daily?
Yes. Enter your values in order; the calculator treats each entry as one period, whether that period is a day, week, month, or year.
Related tools: stock price percentage change calculator & daily vs monthly percentage change.